Tableau Data Visualization: Step by Step Guide
Original price was: $999.00.$49.00Current price is: $49.00.
This Course is available for download now. You can contact us for Screenshots or Demo. Access for this course will be sent on google drive. Join our telegram channel to see updates and occasional discounts. If you want to pay through Paypal or Card contact us – On Telegram Click Here or contact on Mail – [email protected]
Description
Tableau Data Visualization: Step by Step Guide
Genre: eLearning | MP4 | Video: h264, 1280×720 | Audio: AAC, 44.1 KHz Language: English | Size: 1.44 GB | Duration: 63 Lessons (7h)
Tableau is one of the most popular and commonly used data visualization applications in business intelligence.
This class is designed to take you from knowing absolutely nothing about Tableau to becoming proficient analyzing and creating compelling and interactive visualizations with Tableau.
Who is this course for?
If your goal is to become a Tableau Developer, Data Scientist, Data Analyst, Business Intelligence Developer, Business Analyst, Report Analyst, of work with data in any capacity, the importance of knowing Tableau cannot be over emphasized.
This course is designed to equip you with what you need to be successful learning Tableau
Step-by-step guide
Work with over 18 data sources
Lots of practice exercises to solidify your knowledge
Complete 3 guided projects
Course Requirement or Prerequisites
This course does not require any prior knowledge or specific academic background. The only requirement is having a laptop or desktop computer. All applications necessary for learning the course would be downloaded free from the internet.
Hands-on Class Project
Projects
To solidify your knowledge of lessons covered in this class and create your own portfolio, you will work on 3 guided projects.
Below are the project details
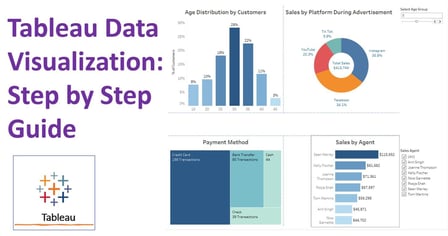
Marketing Campaign Project – Create a dashboard that provides insights into a marketing campaign.
Covid-19 Project – Create an interactive dashboard that shows Covid-19 metrics globally
Customer Incident Report Project – Create a dynamic dashboard that summarizes incident reports
Materials needed to complete the projects can be found in lesson 54 – 61.
Don’t be shy to share your projects once completed.
Happy Learning 🙂
Screenshots


