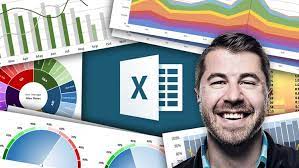
Microsoft Excel: Data Visualization w/ Excel Charts & Graphs
Original price was: $999.00.$49.00Current price is: $49.00.
This Course is available for download now. You can contact us for Screenshots or Demo. Access for this course will be sent on google drive. Join our telegram channel to see updates and occasional discounts. If you want to pay through Paypal or Card contact us – On Telegram Click Here or contact on Mail – [email protected]
Description
Microsoft Excel: Data Visualization w/ Excel Charts & Graphs
Microsoft Excel: Data Visualization w/ Excel Charts & Graphs
4.5 h | Video: AVC (.MP4) 1280×720 30fps | Audio: AAC 44.1KHz 2ch | 704 MB Genre: eLearning | Language: English
Master 20+ Excel charts & graphs in Microsoft Excel 2016 with hands-on demos from a best-selling Excel instructor
Ask people what comes to mind when they think of Excel, and odds are they’ll say “spreadsheets“. The truth is, Excel is an incredibly powerful and dynamic data visualization platform for those willing to think beyond rows, columns, and primitive pie charts — and I’m here to prove it.
This course gives you a deep, 100% comprehensive understanding of Excel’s latest data visualization tools and techniques. I’ll show you when, why, and how to use each Excel chart type, introduce key data visualization best practices, and guide you through interactive, hands-on demos and Excel exercises every step of the way.
We’ll kick things off by exploring each of the 20+ charts & graphs introduced in Excel 2016, including:
- Bar & Column charts
- Histograms & Pareto charts (Office 365, Excel 2016 or Excel 2019)
- Line charts & trend lines
- Area charts
- Pies & Donuts
- Scatter plots & Bubble charts
- Box & Whisker charts (Office 365, Excel 2016 or Excel 2019)
- Tree Maps & Sunbursts (Office 365, Excel 2016 or Excel 2019)
- Waterfall & Funnel charts (Office 365, Excel 2016 or Excel 2019)
- Radar & Stock charts
- Heat maps, 3-D Surface & contour charts
- Chloropleths & Geospatial maps
- Custom combo charts & graphs
- Sparklines
- And more…
From there we’ll dive into a series of 12+ advanced Excel demos guaranteed to turn you into an absolute data viz rockstar. These aren’t “textbook” demos that you can find on Excel YouTube channels; these are projects adapted from actual, award-winning work featured by Microsoft, MIT, and the New York Times. I’ve built my analytics career around data visualization, and I can help you do the same.
We’ll cover advanced Excel data viz topics that you won’t find anywhere else, including:
- Custom image overlay charts


